How much traffic is my listing getting?
To schedule a photoshoot or check availability, go to: /realestate/#get_a_quote.
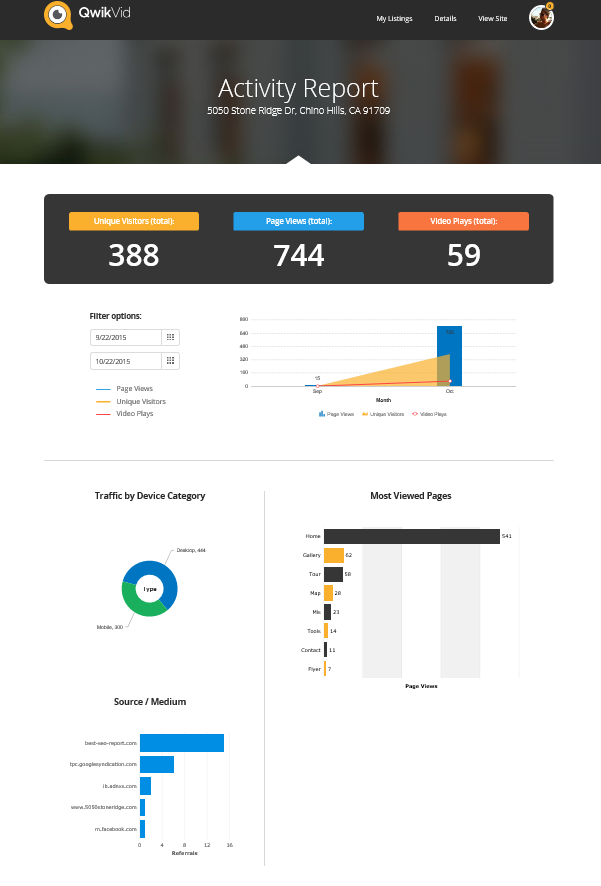
Activity Reports
Reporting is built-in to each of your single property website listings. The report can be run anytime for any date range and gives details about what traffic your site is receiving.
For even more in-depth reporting and demographic data learn more about our integration capabilities with Facebook.
How to run a report:
- Login to your Qwikvid account, at: qwikvid.com/go/login/
- Next click the address of the listing you wish to run a report on.
- Near the top of the page select; Reports > Activity Report.
What do these results mean:
- Page Views - Is the total number of page views your listing received during the selected date range.
- Unique Visitors - Is the total number of "unique" ip addresses that visited your site during the selected date range.
- Video Plays - Is the total number of times the video was played in it entirety during selected date range.
- Based on the date range, the graph will display a visual representation of the results: monthly, daily, or hourly.
- Traffic by Device Category - Tells you if the visitor was on a Desktop or Mobile device.
- Most Viewed Pages - Tells you what pages have been visited most.
- Source / Medium - Show the sites most often referring traffic to yours.